Engagement Tracking through Audit Logs

Like most companies, Lyft is data driven. We have hypotheses and use data to support or invalidate them. If you are reading this blog, you probably have a Clutch gateway instance running and have a custom workflow built. If you ever wondered how often those workflows are being used, we will show you how you can easily use Clutch’s built-in Security Auditing as a way to track and report on usage. The audit middleware saves data on each incoming request to a database and any additional sinks of your choosing. With this data, we can track usage of Clutch itself and its integrations.
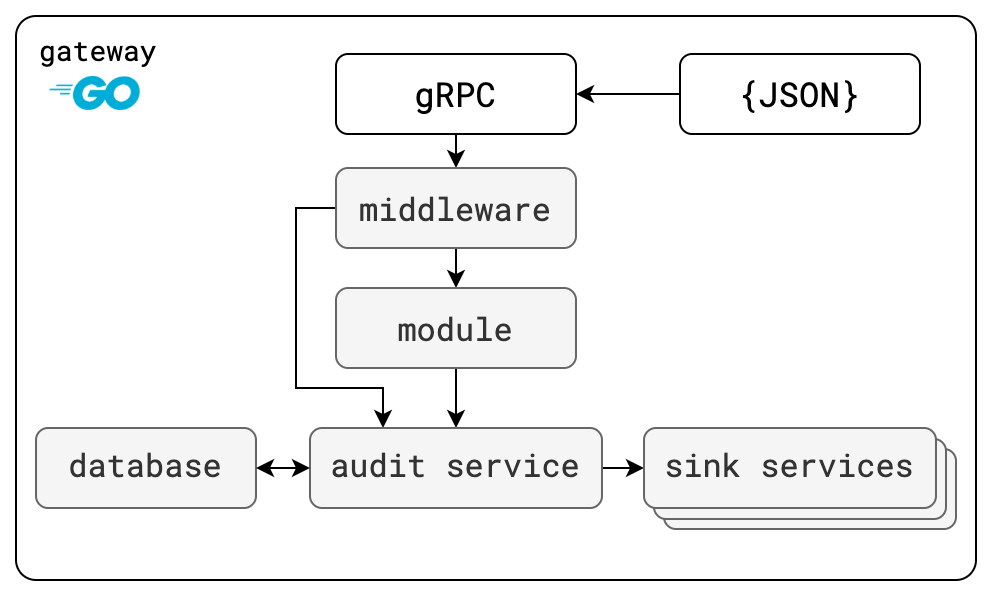
Here’s a recap of Clutch’s security auditing architecture (Security Auditing):
Where are events stored
In Lyft’s configuration, we are storing our audit data to a PostgreSQL database in a table called public.AUDIT_EVENTS. Within AUDIT_EVENTS, there are two columns that are the most relevant to us, OCCURRED_AT and DETAILS.
| Column | Description |
|---|---|
OCCURRED_AT | datetime of the audit event |
DETAILS | event information in JSON |
The event structure
Below is a sample of data that is stored in the DETAILS column.
{
  "type": "READ",
  "status": {
    "code": 0
  },
  "user_name": "user_a",
  "method_name": "Fetch",
  "request_body": {
    "@type": "type.googleapis.com/clutch.assets.v1.FetchRequest"
  },
  "service_name": "clutch.assets.v1.AssetsAPI",
  "response_body": {
    "@type": "type.googleapis.com/clutch.assets.v1.FetchResponse"
  }
}
Querying for events
With the SQL statement below, we are able to get a list of all users and the actions they performed in Clutch over the last 90 days. If you are not familiar with traversing JSON with Postgres, take a quick peek at JSON Functions and Operators.
SELECT
  occurred_at
  , details ->> 'user_name' as user_name
  , details ->> 'method_name' as method_name
FROM
  public.AUDIT_EVENTS
WHERE
  occurred_at >= NOW() - INTERVAL '90d'
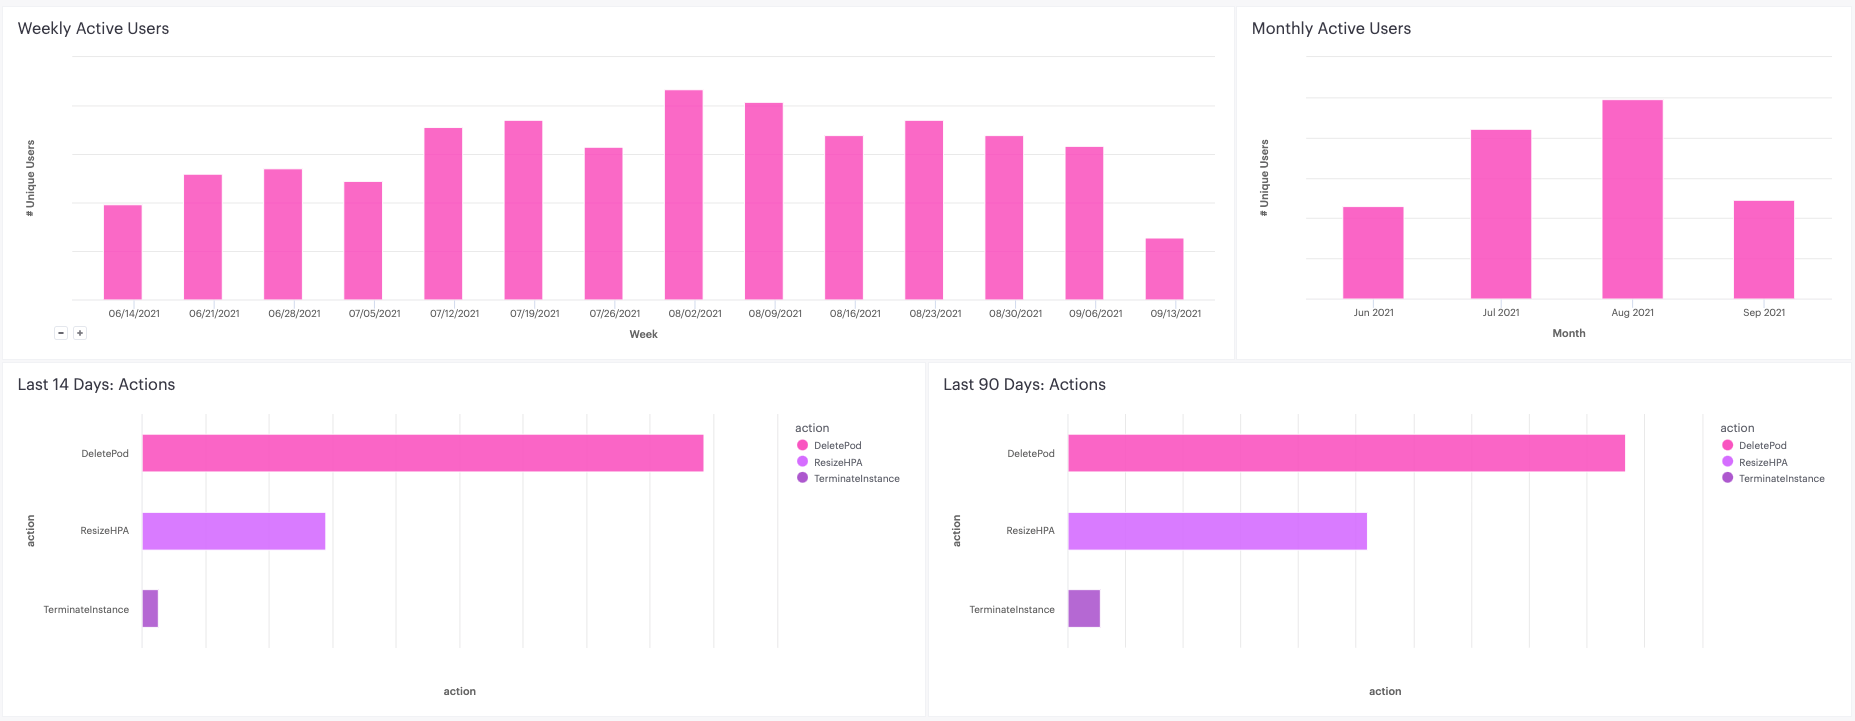
Using a 'Business Intelligence' tool, we can take this data and create nice charts to examine usage over time. We like to look at unique users per month and week as well as actions performed over the last 14 days and 90 days. From these charts, we can easily see which workflows are the most frequently used and how often Clutch is being used.
If you don’t have a charting tool, you’ll need a query for each of these charts.
This query will give you a count of unique users per month for the last 90 days.
SELECT
  DATE_TRUNC('month',occurred_at) AS month
  , COUNT(DISTINCT(details ->> 'user_name'))  as user_count
FROM
  public.AUDIT_EVENTS
WHERE
  occurred_at >= NOW() - INTERVAL '90d'
GROUP BY month
This query will give you all actions performed over the last 14 days and how often they happened.
SELECT
  DISTINCT(details ->> 'method_name')  as method_name
  , COUNT(details ->> 'method_name') as method_name_count
FROM
  public.AUDIT_EVENTS
WHERE
  occurred_at >= NOW() - INTERVAL '14d'
GROUP BY method_name
Conclusion
That’s it! Now, for some nuance. Our audit log only contains events sent to the middleware, so things like button clicks do not get logged. However, without installing tools like Google Analytics, mining the audit log is an easy way to see what your users are taking actions on.
If you are concerned about logging too much or logging sensitive information (e.g. PII), the Clutch middleware supports annotations that prevents a field from being logged.
Annotate the proto with [ (clutch.api.v1.log) = false ] to prevent a field from being logged.
message RequestProxyRequest {
  // The name of a service that is configured
  string service_name = 1 [ (validate.rules).string.min_len = 1 ];
  // The HTTP method that will be used for the request
  string http_method = 2 [ (validate.rules).string.min_len = 1 ];
  // The URI path to call
  string path = 3 [ (validate.rules).string.min_len = 1 ];
  // The request body
  google.protobuf.Value request = 4 [ (clutch.api.v1.log) = false ];
}
At Lyft, for some actions we log entire response objects and are able to generate reports detailing information like how often our Slack integration is being utilized or which specific resources are being actioned against most often, all through the audit logs.
If you are interested in turning on Security Audit logging with Clutch, take a look at our guide.
Have a question? Join us in our Slack!
Want to get involved?
To learn more about Clutch, contribute, or follow along:
- Check our documentation and code
- Join the Community